FacilityConneX Voice Mobile
iOS Universel / Economie et entreprise
FacilityConneX is the VOICE of your equipment!
The FacilityConneX mobile application “VOICE Mobile” is made for the industrial internet to offer real-time data views anytime, anywhere.
FacilityConneX is an intelligent monitoring and knowledge actions system that delivers energy savings and operation efficiency through smart asset monitoring, fault detection and diagnostics, and advanced predictive analytics.
Some key features include:
Anytime, Anywhere
• Real-time Access to Data and Historical Trending
• Default and Self-service Customizable Views
• Collaborative View Sharing and Message Boards
• Equipment Model Driven Navigation
Notifications to Actions
• Notification Message Board w/ User Unread Counts
• Native Push Notifications
• Create Communication Threads
• Scheduled or On-Demand Tasks and Actions Board
• Single or Multi-Step Tasks
• Analytic or Data Triggered Task Escalations
• Overdue Tasks, Unread Alerts, Unread Message Badges
• One-click Trending of Analytic or Data Alerts Focused to the Event
Detection and Diagnostics
• Analytic Summary Rollups and Heatmaps
• Detailed Drill-down Analysis View
• Detailed Analytic Findings
• Analytic Detection Notifications
• Energy and Cost Opportunity Summarization
FacilityConneX’s “VOICE” is super easy to use:
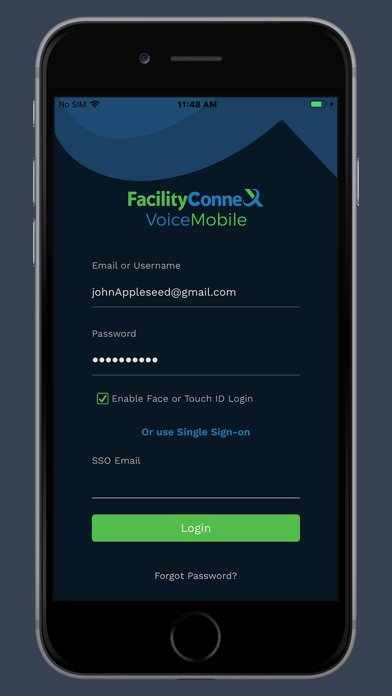
- Login with your FacilityConneX issued username or SSO email
- Choose to use Touch or Face Identification for future logins
- Start Taking Actions, Collaborating, and Analyzing your data in real-time!
- Navigate your equipment model using the equipment tree at the top middle of the application
- View Alerts and Messages at top-right
- Navigate to Tasks or Analytic Specific Views using the top-left menu
- Change your data’s time context using the calendar icon accessible on every view
Get the Information You Need - Start using “VOICE Mobile” today so that your equipment can start telling you what is happening continuously!
Quoi de neuf dans la dernière version ?
- Added extended logging to speed up resolution of user issues and provide insights for product improvement.
- Upgraded to SciChart for iOS charting. All charts and tooltips have been updated (line, column, area, fleet, Historian KPI, KPI Alert, KPI Analytics, spark line, and custom tooltip). Charts now exclude null samples instead of plotting them as zero (matching web behavior), and area charts fill using the series color with transparency so multiple series stay visible.
- Updated supporting libraries.
- Fixed a customer-reported crash from the previous build based on the crash log.