Vernier Graphical Analysis
iOS Universel / Education
Graphical Analysis™ is a tool for science students to collect, graph, and analyze data from Vernier sensors.
Sensor data-collection support:
• Vernier Go Direct® sensors - with Bluetooth® wireless technology
• Vernier Go Wireless® Heart Rate and Go Wireless Exercise Heart Rate monitors
• Vernier LabQuest® sensors used with a LabQuest Stream interface
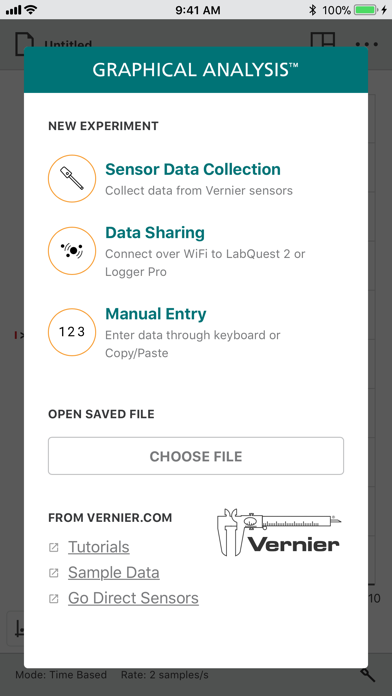
Additional experiment options:
• Data Sharing via Wi-Fi connection to LabQuest 2 or Logger Pro® 3
• Manual Entry
Note: Sensor data collection and Data Sharing require the purchase of hardware from Vernier Science Education. Manual entry of data can be performed without a hardware purchase. For more information on Data Sharing, visit http://www.vernier.com/css
Key Features - Data Collection
• Multi-sensor data-collection support
• Time Based, Event Based, Drop Counting, and Photogate data-collection modes
• Configurable data-collection rate and duration for time-based data collection
• Optional triggering of time-based data collection based on sensor value
• Customizable unit display on supported sensors
• Sensor calibrations
• Option to zero and reverse sensor readings
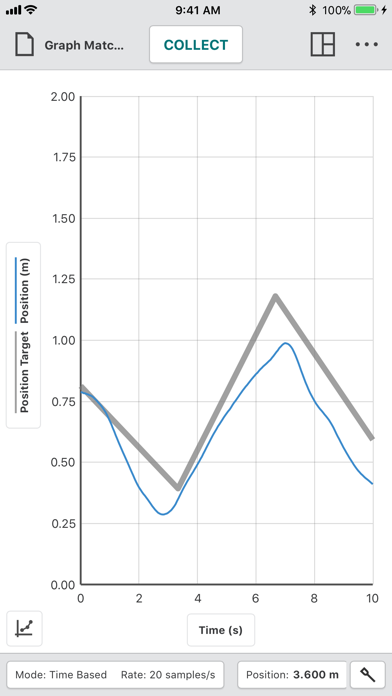
• Graph match feature for use with motion detectors
• Manual entry of data from keyboard and clipboard
Key Features - Data Analysis
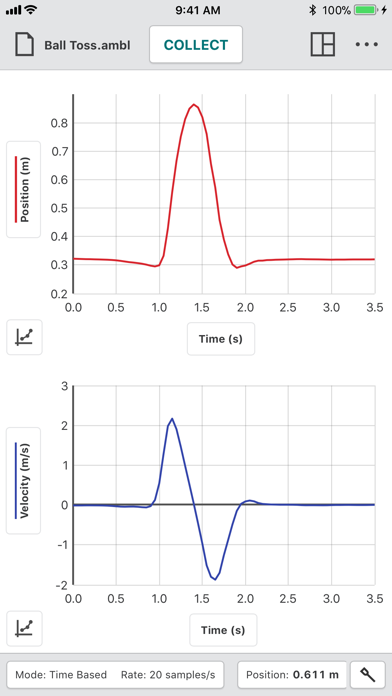
• Display one, two, or three graphs simultaneously
• View data in a table or show a graph and table side-by-side
• Draw Predictions on a graph to uncover misconceptions
• Examine, interpolate/extrapolate, and select data
• Use Tangent tool to show instantaneous rates of change of the data
• Find area under a curve using the Integral tool
• Apply Statistics calculations to find mean, min, max, and standard deviation
• Perform curve fits, including linear, quadratic, natural exponent, and more
• Add calculated columns based on existing data to linearize data or investigate related concepts
Key Features - Collaboration and Sharing
• Create text annotations and add graph titles
• Export graphs and data for printing and inclusion in lab reports
• Export data in .CSV format for analysis of data in spreadsheet software such as Excel, Google Sheets, and Numbers
• Adjust font sizes for easier viewing when presenting to your class
Vernier Science Education has over 35 years of experience in providing effective learning resources for understanding experimental data in science and math classrooms. Graphical Analysis 4 is a part of the extensive system of sensors, interfaces, and data-collection software from Vernier for science and STEM education.
Quoi de neuf dans la dernière version ?
New in Vernier Graphical Analysis 6.3:
• Major accessibility improvements
• Table replaced for accessibility and performance
• Tool for inserting scientific and mathematic characters into text fields
• Improved workflow for distributing authenticated GA Pro to students
• Allow LabQuest files to be opened
• Enable the Reset on Collect feature for a few Go Direct devices
• Support for Go Direct Air Quality
Bug fixes and enhancements:
• Data marks can be moved around the graph
• Fixed issue collecting data from a file saved with averaging during Events mode