Vibration
iOS Universel / Economie et entreprise
Vibration turns your iPhone or iPad into a true FFT vibration spectrum analyzer — a portable alternative to a commercial spectrum analyzer for machinery diagnostics, acoustic testing, and hobbyist vibration analysis.
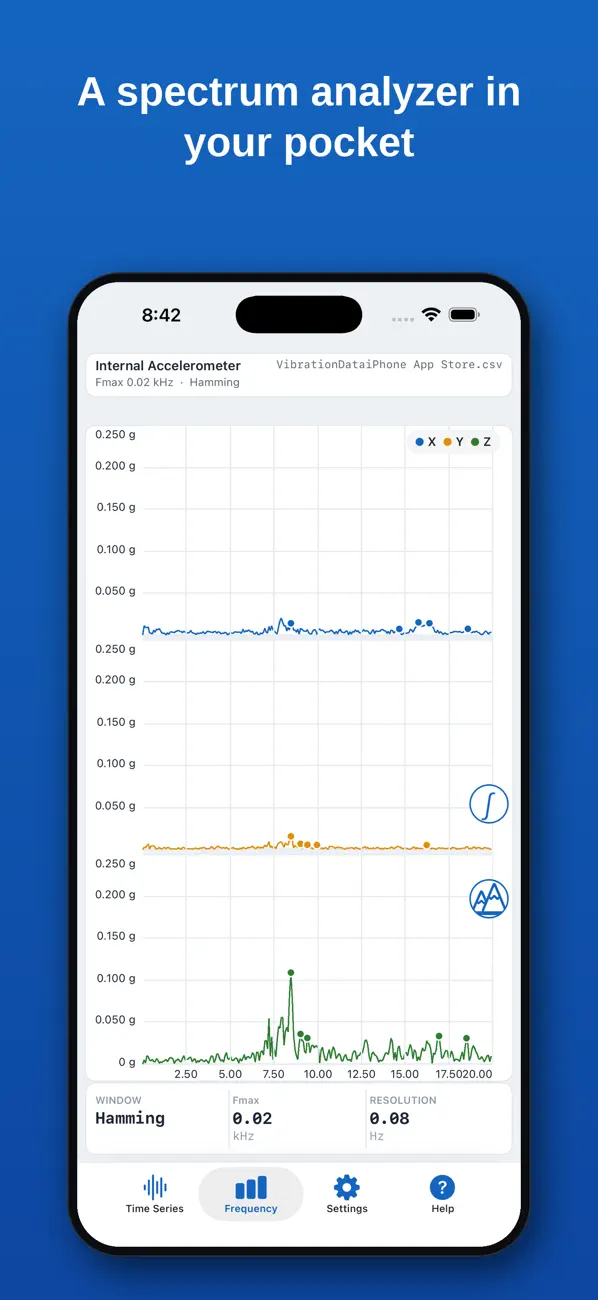
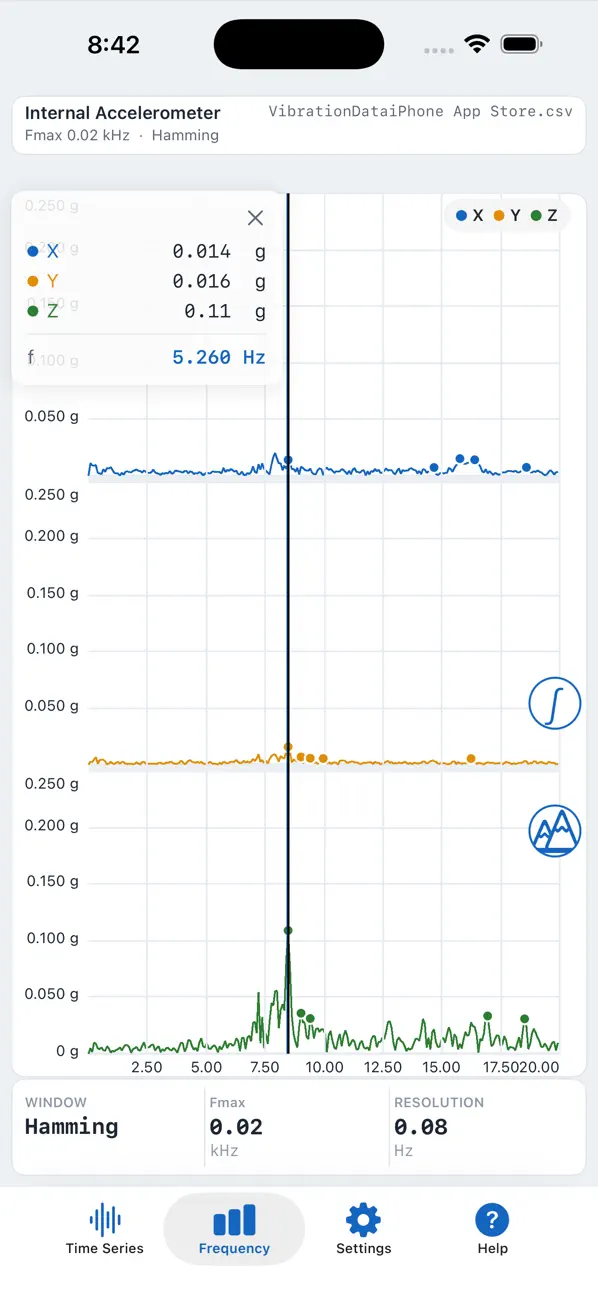
Version 5.00 is a complete visual redesign: a modern, color-coded interface built around the way vibration technicians actually work, with clean, uncluttered screens for every channel and setting, a drag-cursor readout for reading exact values on any plot, and a crisp new PDF report you can generate and share in seconds.
MEASURE FROM ANYWHERE
- Built-in 3-axis accelerometer and gyroscope — sensitivity to about 0.02g, range ±2g
- Built-in microphone input for acoustic vibration analysis
- Digiducer professional USB accelerometer support (additional Digiducer features unlockable via in-app purchase)
ANALYZE LIKE A BENCH-TOP SPECTRUM ANALYZER
- Time series and FFT frequency spectrum on every channel, with adjustable sample rate (10 Hz–100 Hz internal, up to 48 kHz with microphone/Digiducer)
- Linear-Linear, Log-Log, Log-Linear, and Linear-Log frequency display modes
- Hamming, Hanning, and Flattop windowing
- Integrate and differentiate in the frequency domain
- RMS and peak levels per channel and combined
- Frequency averaging and peak hold
- Color-coded peaks list with the top 5 peaks per channel
- Tap-and-drag cursor readout in portrait or landscape, with magnetic snap to peaks
- Selectable data length from 256 to 4096 samples, variable start delay up to 20 seconds
- DC-remove option to eliminate the gravity vector
BUILT FOR THE FIELD
- Guided accelerometer calibration with an on-screen orientation guide, live stability meter, and a locked reposition countdown
- Trigger acquisitions from one or more accelerometer channels or the microphone
- Auto-repeat and auto-save for long-duration monitoring
- Apple Watch companion app — trigger a sample and review settings right from your wrist
DOCUMENT YOUR RESULTS
- New crisp PDF report — identical on iPhone and iPad — with time series and frequency plots and acquisition details
- Open, non-proprietary format — data saves as plain CSV you can reload in the app or open in Excel, MATLAB, or Python, and email straight to your desktop
- Save data locally and transfer with the Files app
- Screen snapshots sync to your computer like any photo
In many applications, Vibration is an excellent portable alternative to a commercial spectrum analyzer. In predictive maintenance applications it can help identify bearing defects, shaft misalignment, imbalance, and structural resonant frequencies — and it's equally useful for monitoring the acceleration of part and material handling equipment.
Further development and additional features are planned. Use the email links in the app to request features or report issues.
Quoi de neuf dans la dernière version ?
- Apple Watch reliability improvements: the watch screen now shows
the current sensor and settings as soon as it opens, and updates
correctly when the iPhone app is launched
- Bug fixes and stability improvements