Art of Stat: Inference
iOS Universel / Education
**********
News: The Inference app is now part of the all new "Art of Stat" app, a single app that contains Inference and seven other modules (Explore Data, Distributions, Concepts, Regression, Machine Learning, Resampling and Data Editor)
Please consider getting the Art of Stat app for the latest updates and features from the App Store. Simply search for "Ar of Stat" on the App Store. This app will continue to work, but future development is concentrated on the new Art of Stat app.
*********
Statistical calculator for inference (confidence intervals and hypothesis tests) about proportions and means.
The Art of Stat: Inference app provides:
- Inference for Proportions
+ one sample (z-test)
+ two independent samples (two sample z-test)
+ two dependent samples (McNemar)
- Inference for Means
+ one sample (t-test)
+ two independent samples (two-sample t-test)
+ two dependent samples (paired t-test)
+ several means (One-way ANOVA)
- Chi-Square Test
+ Goodness of Fit (one sample)
+ Independence/Homogeneity (contingency table)
- Data Editor
+ Create or edit datasets
Unlock all modules for a one-time small fee!
Entering your own data is easy:
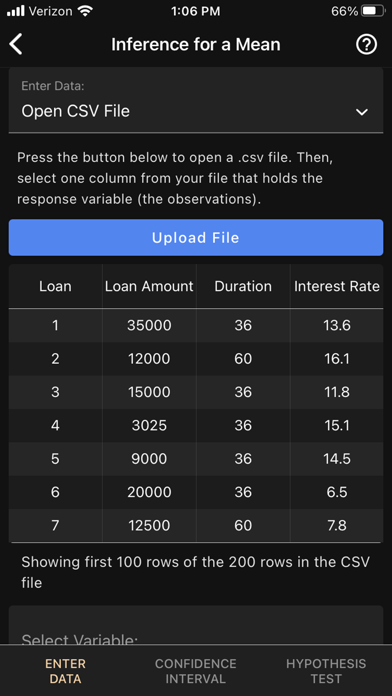
If you just have a few observations (or if you have the summary statistics), simply type them in. For larger datasets, upload a CSV file of your raw data to a cloud account (such as iCloud or Google Drive) or email the file to yourself and save it on your device. Then, open the CSV file in the app and select the variables for your analysis. You can also simply copy & paste raw data from a spreadsheet app (such as Numbers on iOS or Google sheets).
To illustrate all methods, several example datasets are provided for each procedure.
The results are stunning:
The app provides relevant plots (side-by-side or stacked bar charts, boxplots, histograms) and computes and visualizes confidence intervals and P-values for testing hypotheses. All relevant information (such as standard errors, margin of errors, z- or t-scores and degrees of freedom) are clearly displayed and labeled. The P-value is visualized on a graph for the normal, t-, Chi-Squared or F-distribution.
Developed for both students and teachers as a handy tool for carrying out basic statistical inference and visualize results on the fly.
The app works in on- and offline mode (the app indicates that it is in offline mode with a large green banner), which makes it suitable for exams.
Easily share your results by taking screenshots.
Quoi de neuf dans la dernière version ?
- Legacy Version: Continuous to work, but I recommend upgrading to the new "Art of Stat" app, which contains this and 7 other modules for one powerful app.
- Search for "Art of Stat" in the App Store.