
Electricity Maps
iOS Universel / Utilitaires
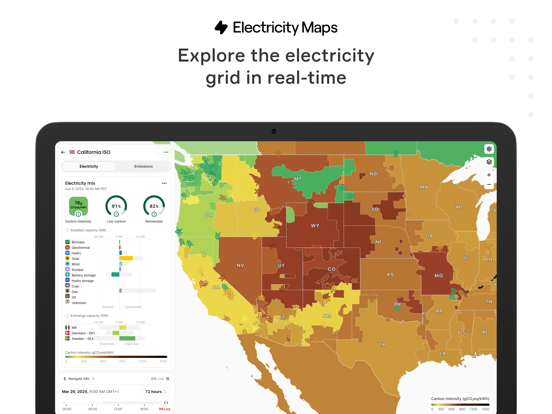
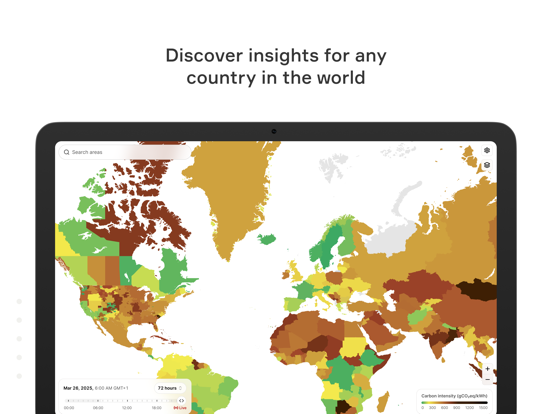
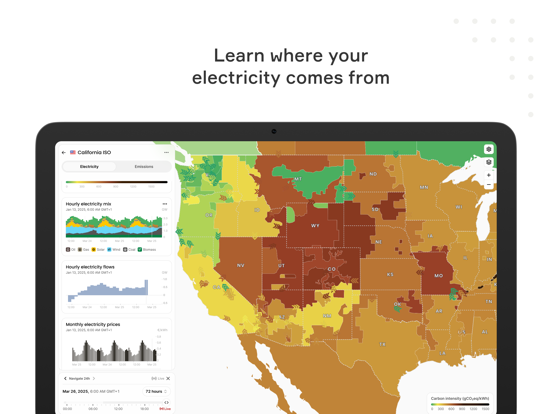
Electricity Maps is a live visualization tool that shows where your electricity comes from and how much CO2 was emitted to produce it.
The app displays power production breakdowns, carbon intensity of electricity, total emissions, and electricity exchanges for over 200 regions worldwide.
Interested in using the data behind the Electricity Maps app? We offer a free API for non-commercial use and sell access to a real-time API for commercial use, which includes forecasts and more. Find out more on our website: https://www.electricitymaps.com/get-our-data
Quoi de neuf dans la dernière version ?
- You asked for it, and now it’s back: Yearly aggregates can be found by choosing All Years in the new time range selector!
- One settings to rule them all: New consolidated settings popover
- Various text changes and bug fixes