Trellis Dashboard
iOS Universel / Economie et entreprise
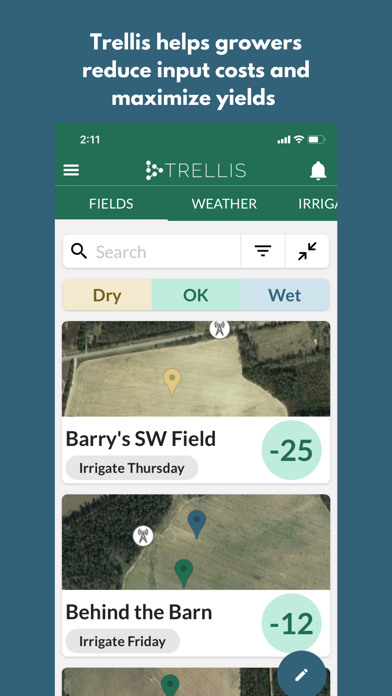
Trellis' easy-to-use farm intelligence platform helps growers maximize yields & reduce input costs. The Trellis Dashboard application allows you to view your data on-the-go.
This app allows you to:
- View graphs of live sensor data (soil moisture, temperature, electroconductivity, pressure sensors)
- View, edit, & delete weather data from connected rain gauge, weather station, or NOAA data
- Log irrigation & precipitation events
- Sensor Management Plans let you customize the way the sensor station data is interpreted throughout the growing season. As your crop develops, you can account for changing root depths & different crop growth stages that may require more or less water.
- Group sensors into fields and weight the sensors in each field
- Edit sensor information
- Change how you're notified that a sensor is dry (text/email notifications)
- View your sensors & their soil moisture status (wet/ok/dry) on a map
- Browse our knowledge base of helpful support articles & chat with Trellis employees to answer questions
Quoi de neuf dans la dernière version ?
It’s finally spring time and that means a little spring cleaning!
-Page Updates-
Our most visited pages are easier to read & navigate. Clearing the clutter was our goal.
-Graph Previews-
Get moisture, temperature, & salinity graphs in fewer taps.
-Action Buttons-
We condensed our buttons into one big button at the bottom right of the screen on most pages.
-Install Mode-
A step-by-step guide for installing sensors & base stations. We’ll tell you if the hardware was installed correctly before you leave the field.