CiPol
macOS / developpeurs
CiPol: An Open Source Jenkins Monitoring Tool
Introduction
CiPol (Continuous Integration Poller) is a straightforward program designed to assist you in monitoring your Jenkins builds. This software is open-source and freely available under the GPL license.
Currently, the Jenkins servers at my company effectively notify developers who check in code if their code has caused an issue that disrupted the build process. However, if you are not the developer who checked in the code but still need to be informed about any issues, you may not notice them for some time. This tool monitors selected Jenkins builds at a polling interval of your choice and promptly informs you of any changes.
Setting Up CiPol
Server Setup
To begin, you need to define a Jenkins server. Click the ‘Servers’ button on the main window to open the Server Admin screen. From there, click the ‘Add Servers’ button.
In this section, you can select any ‘Server Name’ of your preference. The URL should be formatted as “https://myjenkinsServer/mycompany.net”. If you have a specific subdirectory you want to scan, you can add it here, but it’s not mandatory.
Username and API Token are optional. If your server doesn’t require authentication to view jobs, you can leave these fields blank. However, if authentication is necessary, you must use an API Token issued by your Jenkins server. All tokens are securely stored in your Mac OS keychain. To obtain an API Token from your Jenkins server, navigate to your user settings and then go to Configure. You should find an API Token section where you can generate a token.
To modify an entry, simply double-click on a server line and make the necessary changes.
To delete an entry, right-click on it and select the “Delete” option.
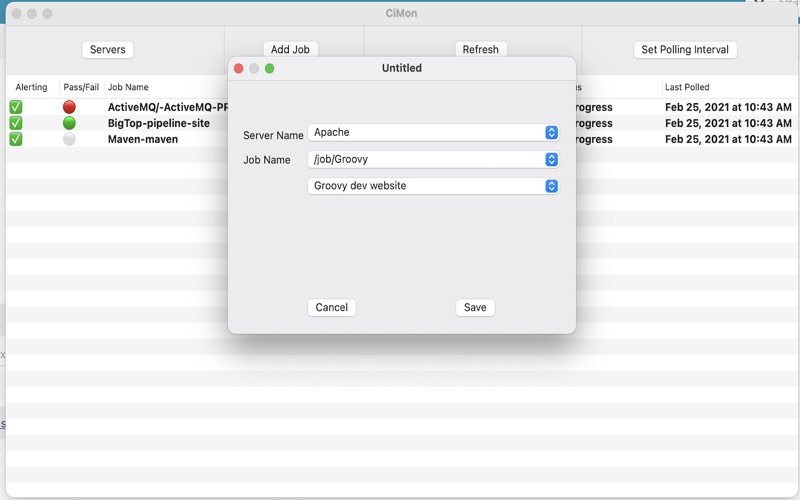
Job Setup
Once a server is set up, you can proceed to set up a job. To do this, click on the “Add Job” button. This will open two pull-down menus. For the server menu, select one of the servers you have just configured. This will populate the job menu with available choices that have been scanned from your server.
If a choice is represented as “/job/{job name}”, it indicates that it is a folder rather than a direct job. When you select one of these entries, a new pull-down menu will appear, displaying the job within that folder. Up to four menu levels are supported. Once you have chosen the job you wish to monitor, click on the “Save” button.
The menu will only display folders and jobs that have passed or failed tests. If a test is disabled, it will not be included in the menu.
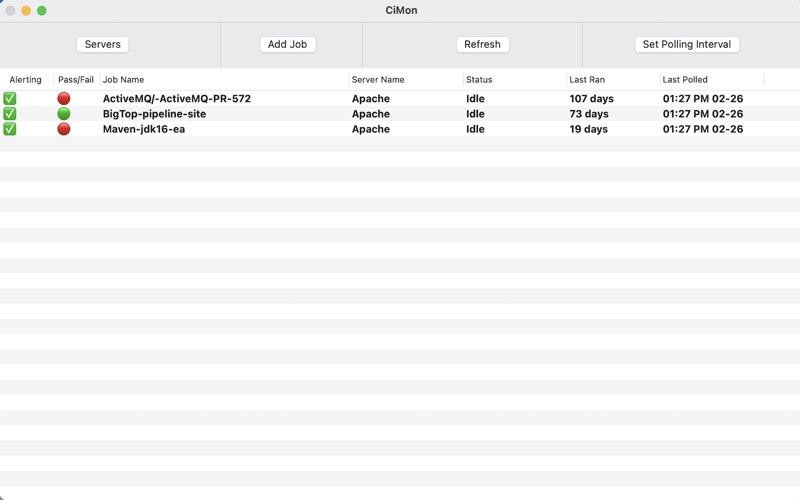
Main Screen
The main screen offers several features:
- Double-clicking on any job will take you to that job on your Jenkins server in your preferred browser.
- Clicking the “Refresh” button will immediately update all job data displayed.
- Clicking the “Polling Interval” button allows you to adjust the frequency of automatic data polling from the Jenkins servers and refreshing. The default setting is 10 minutes.
- Right-clicking on any job will enable you to delete it.
- Clicking the “Monitoring” checkbox in the leftmost column will toggle the monitoring status. When monitoring is off, you won’t receive alerts when the job status changes. Additionally, the icon in the tray bar will remain unaffected by the test outcome when monitoring is disabled.
Privacy Policy
This program does not collect any data of any kind. The only outgoing network traffic generated by this program is to the Jenkins servers that you have configured. All notifications are handled locally.
Quoi de neuf dans la dernière version ?
Just updated text in the app description.